Technical Analysis Basics for Crypto Traders
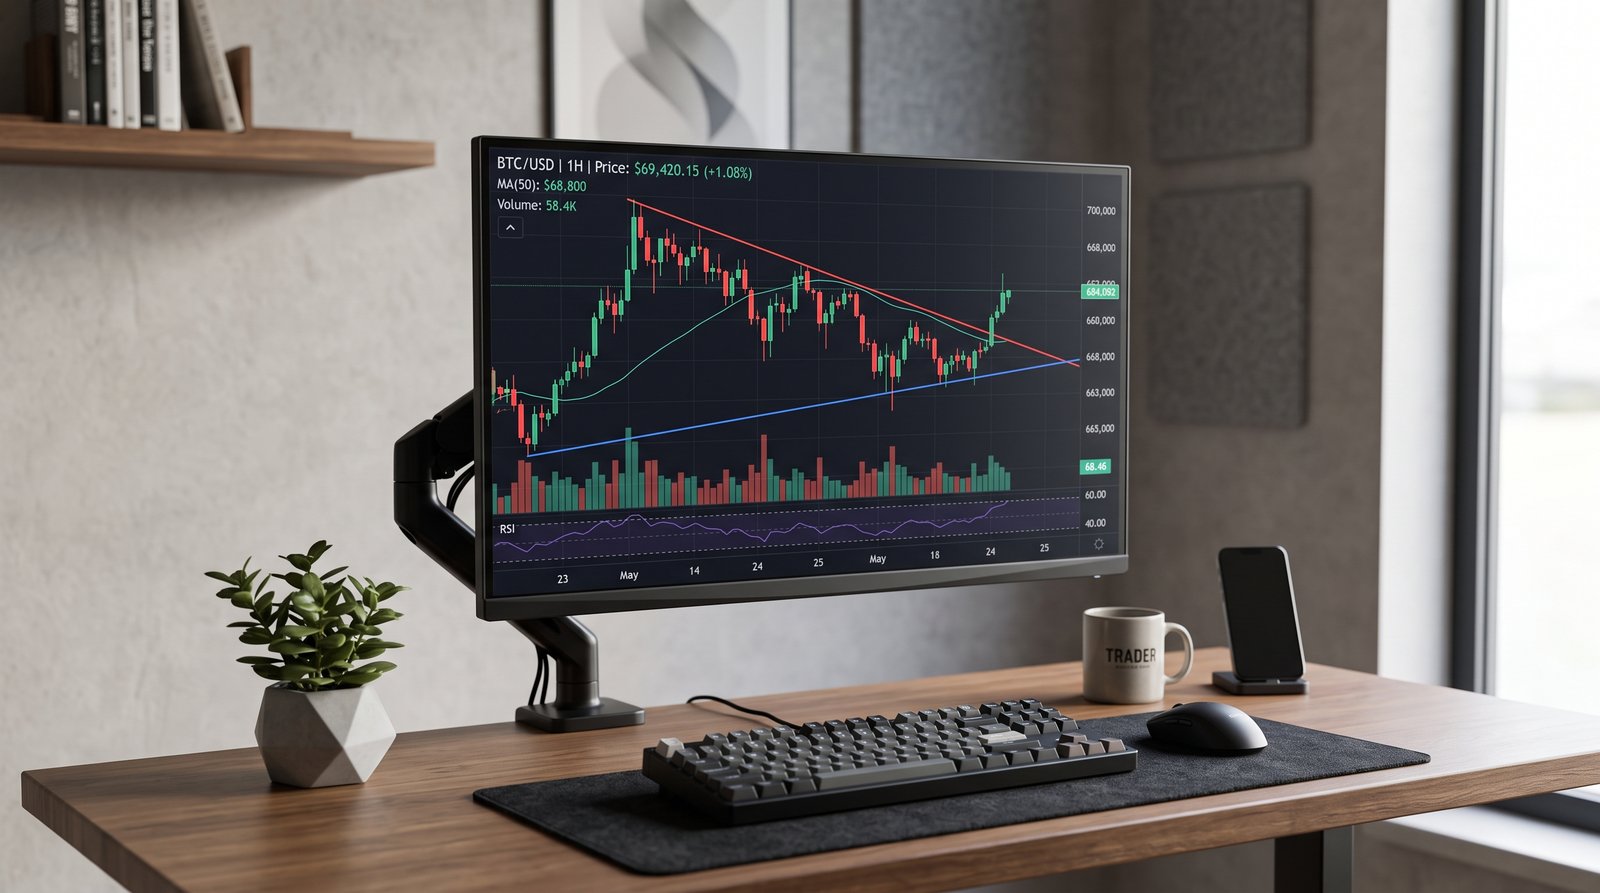
Technical analysis is the cornerstone of cryptocurrency trading. By studying historical price data, volume patterns, and market statistics, traders can make informed predictions about future price movements. While no analysis method guarantees success, technical analysis provides a systematic framework for identifying trading opportunities and managing risk. This guide covers everything you need to know to start applying technical analysis to your crypto trading.
What Is Technical Analysis?
Technical analysis is the study of market action primarily through the use of charts and indicators. It is based on three fundamental principles. First, market action discounts everything — all known information about an asset is already reflected in its price. Second, prices move in trends. Third, history tends to repeat itself because market participants react to similar situations in consistent ways over time.
Unlike fundamental analysis which examines the intrinsic value of an asset, technical analysis focuses exclusively on price and volume data. This makes it particularly well-suited for cryptocurrency trading, where fundamental valuations can be difficult to determine and market psychology plays an outsized role in price movements.
Types of Charts
Line Charts
Line charts are the simplest type of chart. They plot the closing price of an asset over a specified time period, connecting each closing price with a continuous line. Line charts provide a clean view of overall price trends but do not show the price action within each period. They are best used for identifying long-term trends and major support and resistance levels.
Bar Charts
Bar charts display the open, high, low, and close prices for each time period. A vertical line represents the high-to-low range, while small horizontal lines on the left and right indicate the opening and closing prices. Bar charts provide more information than line charts but can be more difficult to read at a glance.
Candlestick Charts
Candlestick charts are the most popular chart type among crypto traders. Each candlestick shows the open, high, low, and close price for a specific time period. The body of the candle represents the range between the open and close, with different colors indicating whether the price increased or decreased. The wicks or shadows extend to the high and low of the period.
Candlestick patterns, formed by one or more candles, provide valuable information about market sentiment and potential price reversals. Common patterns include doji, hammer, engulfing, shooting star, and morning star. Learning to recognize these patterns can significantly improve your ability to anticipate market movements.
Support and Resistance
Support and resistance are fundamental concepts in technical analysis. Support is a price level where buying pressure is expected to overcome selling pressure, causing a downtrend to pause or reverse. Resistance is a price level where selling pressure is expected to overcome buying pressure, causing an uptrend to pause or reverse.
Support and resistance levels form at price points where the market has historically reversed direction. They can be horizontal levels, trend lines, or dynamic levels created by moving averages. When a support or resistance level is broken, its role often reverses — broken support becomes new resistance and broken resistance becomes new support. Understanding these dynamics helps traders identify optimal entry and exit points.
Trend Analysis
The concept of trends is central to technical analysis. An uptrend is characterized by a series of higher highs and higher lows. A downtrend is characterized by a series of lower highs and lower lows. A sideways or ranging market has no clear directional bias.
Traders use trend lines to visualize trends. An uptrend line connects successive higher lows, while a downtrend line connects successive lower highs. The angle and duration of a trend provide information about its strength. Steep trends are often unsustainable and prone to reversals, while gradual trends tend to be more durable. Always trade in the direction of the prevailing trend for higher probability setups.
Volume Analysis
Volume measures the number of units traded during a given period. It is a critical confirming indicator in technical analysis. High volume confirms the validity of a price movement, while low volume suggests the movement may lack conviction. Volume should increase in the direction of the trend — rising volume in an uptrend confirms buying pressure, while rising volume in a downtrend confirms selling pressure.
Volume divergences can signal potential reversals. If price reaches a new high but volume is declining, it suggests that the buying pressure is weakening and a reversal may be imminent. Similarly, if price reaches a new low on declining volume, it suggests selling pressure is exhausting. Paying attention to volume patterns helps you distinguish between genuine breakouts and false moves.
Common Chart Patterns
Reversal Patterns
Reversal patterns signal that the current trend is about to change direction. The head and shoulders pattern consists of three peaks with the middle peak being the highest, signaling a trend reversal from bullish to bearish. Double tops and double bottoms form when price tests a support or resistance level twice and fails to break through, indicating a potential reversal. These patterns are among the most reliable in technical analysis.
Continuation Patterns
Continuation patterns suggest that the current trend will resume after a pause. Triangles — ascending, descending, and symmetrical — form as price consolidates within converging trend lines before breaking out in the direction of the prevailing trend. Flags and pennants are short-term consolidation patterns that typically result in a continuation of the prior move. These patterns help traders identify opportunities to add to existing positions.
Moving Averages
Moving averages smooth price data to help identify trends and filter out noise. The simple moving average calculates the average price over a specified period. The exponential moving average gives more weight to recent prices, making it more responsive to new information. Common periods include the twenty-day, fifty-day, one-hundred-day, and two-hundred-day moving averages.
Moving averages can serve as dynamic support and resistance levels. In an uptrend, the price often finds support at key moving averages. In a downtrend, moving averages act as resistance. Crossovers between shorter and longer moving averages generate trading signals. When a shorter moving average crosses above a longer one, it is considered bullish. The opposite crossover is bearish.
Oscillators and Momentum Indicators
Oscillators help identify overbought and oversold conditions. The Relative Strength Index measures the speed and magnitude of price changes on a scale of zero to one hundred. Readings above seventy indicate overbought conditions, while readings below thirty indicate oversold conditions. The Stochastic Oscillator compares the closing price to its price range over a given period, providing similar signals.
The MACD indicator shows the relationship between two moving averages. It consists of the MACD line, the signal line, and the histogram. When the MACD line crosses above the signal line, it generates a bullish signal. A cross below is bearish. MACD divergences — when price makes a new high or low but MACD does not — are powerful reversal signals that often precede significant trend changes.
Putting It All Together
No single indicator or pattern is reliable enough to base all trading decisions on. Successful technical analysis combines multiple tools to create a comprehensive market view. A typical approach might start with trend analysis to determine the overall direction, use support and resistance to identify potential entry and exit points, employ volume to confirm price movements, and utilize oscillators to time entries in favorable zones.
The key is to develop a consistent methodology and apply it systematically. Avoid the temptation to add too many indicators to your charts — this creates confusion and leads to analysis paralysis. Focus on a few reliable tools, master them thoroughly, and build a trading system around them. With practice, technical analysis becomes an intuitive skill that guides your trading decisions with confidence.
Conclusion
Technical analysis is an essential skill for crypto traders. It provides a structured approach to understanding market behavior, identifying trading opportunities, and managing risk. While it requires time and practice to master, the foundational concepts — chart reading, support and resistance, trend analysis, volume analysis, and key indicators — can be learned by any dedicated trader.
Start by practicing on historical charts to identify patterns and test your analysis. Use demo accounts to apply your skills in real-time without risking capital. Keep a journal of your analysis and trades to track your accuracy and identify areas for improvement. With consistent practice and continuous learning, technical analysis will become an invaluable part of your trading toolkit.