Best Crypto Trading Indicators Explained
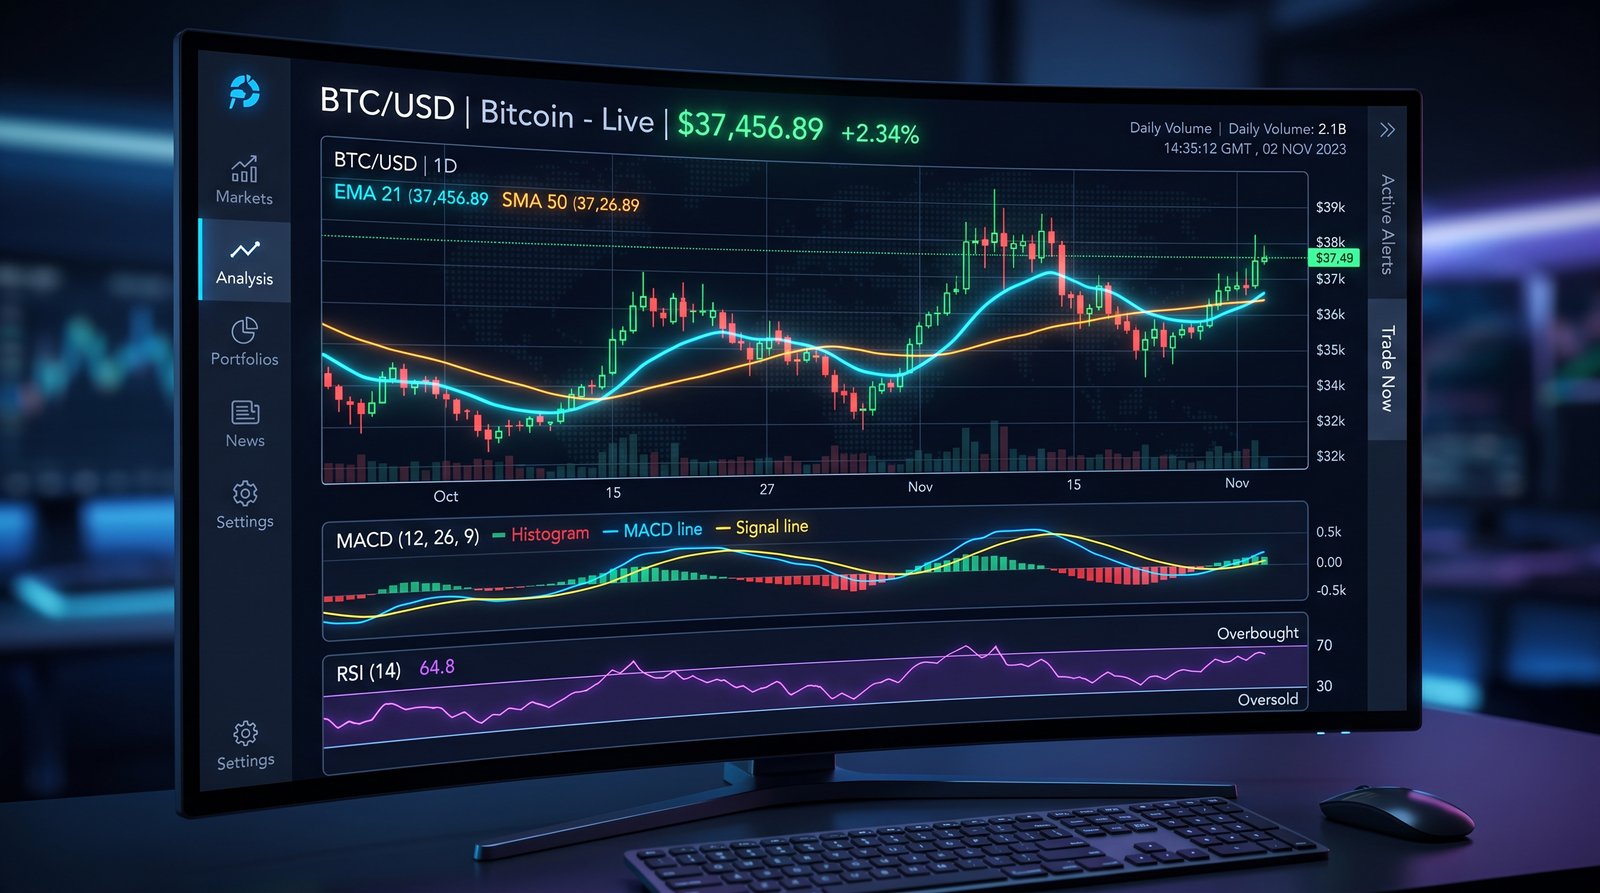
Trading indicators are mathematical calculations based on price, volume, and other market data that help traders analyze market conditions and make informed trading decisions. With hundreds of indicators available, knowing which ones to use and how to interpret them is essential for successful crypto trading. This comprehensive guide explains the most effective indicators for cryptocurrency markets and how to combine them into a coherent trading system.
Understanding Indicator Categories
Trading indicators fall into several categories, each serving a different purpose. Trend indicators help identify the direction and strength of a trend. Momentum indicators measure the speed of price changes. Volatility indicators show how much price fluctuates. Volume indicators analyze trading activity. The most effective traders combine indicators from different categories to create a comprehensive market analysis.
The key principle is to avoid using too many indicators from the same category, as they often provide redundant information and can lead to conflicting signals. A balanced approach using one or two indicators from different categories provides a clearer market picture without the confusion of indicator overload.
Moving Averages
Moving averages are the most widely used trend-following indicators. They smooth price data to filter out noise and help traders identify the direction and strength of trends. The simple moving average calculates the average price over a specified number of periods. The exponential moving average gives greater weight to recent prices, making it more responsive to new information.
The two-hundred-period moving average is particularly significant in crypto trading. It is widely watched by institutional and retail traders alike and often acts as a major support or resistance level. The fifty-period moving average is used for medium-term trend analysis, while the twenty-period moving average helps identify short-term trends. When shorter moving averages are above longer ones, the trend is considered bullish. The opposite alignment indicates a bearish trend.
Relative Strength Index
The Relative Strength Index is one of the most popular momentum indicators. It measures the speed and magnitude of recent price changes on a scale of zero to one hundred. Traditionally, readings above seventy indicate overbought conditions and readings below thirty indicate oversold conditions. However, in strong trends, RSI can remain in overbought or oversold territory for extended periods.
More experienced traders focus on RSI divergences rather than absolute levels. A bullish divergence occurs when price makes a lower low while RSI makes a higher low, suggesting that selling momentum is weakening and a reversal may be imminent. A bearish divergence occurs when price makes a higher high while RSI makes a lower high, indicating weakening buying pressure. Divergences are among the most reliable signals generated by RSI.
MACD
The Moving Average Convergence Divergence indicator consists of three components. The MACD line is calculated by subtracting the twenty-six-period exponential moving average from the twelve-period exponential moving average. The signal line is a nine-period exponential moving average of the MACD line. The histogram represents the difference between the MACD line and the signal line.
When the MACD line crosses above the signal line, it generates a bullish signal. A cross below the signal line is bearish. The MACD histogram provides additional information about momentum. When the histogram is rising, momentum is increasing in the direction of the trend. When it is falling, momentum is weakening. MACD divergences, similar to RSI divergences, are powerful reversal signals that often precede significant trend changes.
Bollinger Bands
Bollinger Bands consist of a middle band which is a twenty-period simple moving average, and upper and lower bands that are two standard deviations away from the middle band. The bands expand and contract based on market volatility. When volatility is high, the bands widen. When volatility is low, they narrow.
Bollinger Bands serve multiple purposes. Price touching or exceeding the upper band indicates overbought conditions, while touching or exceeding the lower band indicates oversold conditions. However, in strong trends, price can walk the upper or lower band for extended periods. Band squeeze patterns — when the bands narrow significantly — often precede explosive price movements. Bollinger Bands are particularly effective when combined with other indicators like RSI for confirmation.
Fibonacci Retracement
Fibonacci retracement levels are based on the mathematical relationships discovered by Leonardo Fibonacci. The key levels in trading are twenty-three point six percent, thirty-eight point two percent, fifty percent, sixty-one point eight percent, and seventy-eight point six percent. These levels represent potential support and resistance areas where price may reverse during a pullback.
The sixty-one point eight percent level is the most significant and is known as the golden ratio. Price reversals at Fibonacci levels carry more weight when they coincide with other technical factors such as moving averages, trend lines, or previous support and resistance levels. Fibonacci extensions can also be used to project potential price targets in the direction of the trend.
Volume Indicators
On-Balance Volume
On-Balance Volume is a cumulative volume indicator that adds volume on up days and subtracts volume on down days. It helps confirm price trends. When OBV is rising, volume is flowing into the asset, supporting an uptrend. When OBV is falling, volume is flowing out, supporting a downtrend. Divergences between OBV and price are early warning signals of potential trend reversals.
Volume Profile
Volume profile displays trading activity at specific price levels over a specified period. Unlike traditional volume indicators that show volume over time, volume profile shows volume at price. High-volume nodes indicate price levels where significant trading activity occurred, often acting as support or resistance. Low-volume nodes represent areas where price moved quickly, often leading to rapid price movements when revisited.
Ichimoku Cloud
The Ichimoku Cloud is a comprehensive indicator that provides information about support and resistance, trend direction, momentum, and trading signals all at once. It consists of five lines: Tenkan-sen, Kijun-sen, Senkou Span A, Senkou Span B, and Chikou Span. The area between Senkou Span A and Senkou Span B forms the cloud.
When price is above the cloud, the overall trend is bullish. When below, it is bearish. The cloud itself serves as dynamic support and resistance. Thicker cloud layers provide stronger support or resistance. The Ichimoku Cloud is particularly effective on higher timeframes and provides reliable trend information at a glance.
Combining Indicators Effectively
The most effective trading systems combine indicators from different categories to confirm signals and filter out false ones. A common approach is to use a trend indicator like moving averages to determine the overall direction, a momentum indicator like RSI to identify entry timing, and a volatility indicator like Bollinger Bands to set stop-loss and take-profit levels.
When multiple indicators align, the setup has a higher probability of success. For example, a bullish signal from all three categories — trend, momentum, and volatility — provides stronger confirmation than any single indicator alone. This principle of confluence is fundamental to professional trading. Develop a system that combines indicators logically and stick to it consistently.
Common Indicator Mistakes
The most common mistake traders make with indicators is using too many at once. Charts cluttered with indicators create confusion and lead to analysis paralysis. Another mistake is using indicators in isolation without considering broader market context. No indicator works perfectly in all market conditions.
Some traders fall into the trap of indicator hopping — switching between different indicators whenever they experience a losing streak. This prevents them from developing mastery of any single tool. Instead, select a few indicators, learn them thoroughly, and commit to using them consistently. Mastery comes from deep understanding and extensive practice, not from constantly searching for the perfect indicator.
Conclusion
Trading indicators are powerful tools that enhance your ability to analyze markets and make informed trading decisions. Moving averages, RSI, MACD, Bollinger Bands, Fibonacci, and volume indicators each provide unique insights into market conditions. The key to success is not using more indicators but using the right ones in combination.
Focus on understanding how each indicator works, what it measures, and under what conditions it performs best. Practice identifying indicator signals on historical charts before using them in live trading. Build a coherent system that combines indicators logically and provides clear, actionable signals. With time and practice, trading indicators will become an invaluable part of your trading methodology.